1st- It is Day Candle wise chart .....
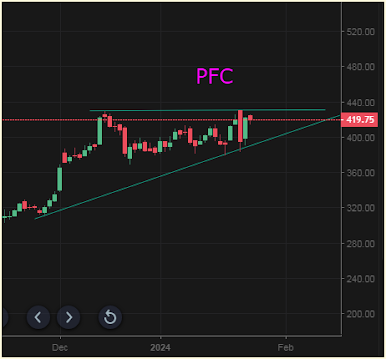
2nd- Ready for Buy This Stock...

3rd- Will Breakout After Some Days.keep follow on it

For more update keep eye on it.
Thank you.
1st- It is Day Candle wise chart .....
Reliance Technical Analysis
Respected Trader&Investor,
Reliance industry one of the largest industry in India,
Today I will discuss about this industry with Technical Analysis.
Technical analysis pure based on Technical Tools.
Let’s began…

In weekly chart ,which you can see on this picture. Reliance chart, break down their trend line support area. At the same time RSI trend line break down also.
In this situation Seller may be falling trap, because this is a correction period, or profit booking period.
During this period ,maximum seller, who created short position at near about 2500.
And now they are booking their profit or may be trilling their profit.
So, this time new position will be above 2480 for buying .
Now we will know about next position With using this picture bellow:

Traders have known ,that ‘W’ pattern or ‘M’ pattern on candlesticks chart or on RSI .
Many trader consider this type pattern as Elliott Waves .They things ‘W’ pattern and ‘M’ pattern one of the part of eleit waves theory.
Whatever, according to above this picture we may trade on it, with using a proper Stop Loss Area.
Medium short term or Swing Trading would be easily knowledgeable, if you know about “Higher-High “or “Higher-Low”, pattern.
This picture may be giving you a clear guide (bellow):

In this situation Profitable Trader keep their trailing Stop-Loss bellow “HL” in Buy position.
And they also set their trailing Stop-Loss above “LH” in Short Position.
I hope, you got it clearly. Please practice it, Search it from many stock, like –Nifty-500 stocks, Nasdq-100/30, commend me where you feel difficult.
Sir!! Always remember one things, Success may be hidden behind a little word.
Whatever, next I have another report on this Stock. We know very well the Candle Stick Pattern, like-
“Morning Star” or “Evening Star”. Believe me This type pattern works 80% time, But time-frame very depended on it.
Now, I will give you a clear view with using this picture below:

On this picture, Left side candlesticks pattern called “Morning- Star” you know, which covert by a circle. It is a trend reversal pattern.
It means, stock will goes up with creating Higher-High and higher low formation.
In present situation “Reliance” chart may create this type pattern on right side, which is mention by a circle ,which is clearly visible above the picture.
So we can take a long position, when this type pattern or situation will create.
Thank You So much for visiting my blog. Commend me any Stock related quire, ”Stock Cloud” help you with best of knowlwdge.
Tesla/TSLA (NASDAQ) Technical Analysis
Respected, All Trader&Investor
with the blessings of all.
Today I will Discuss About - TSLA,
we know that The TSLA is a great company which belong to or highlighted based on Elon Musk this time.
The growing company ,which is known to all. But,The biggest subject is 'How To Trade' on it.
From my opinion,Tesla is a best stock.The Investor may invest on for Long Term basis.
'Long Term' is an words which is not except-able type feeling near to Short Term or Swing Trader.
They always try to reach or find out a good entry or exit point. So, they try with using Technical Analysis which besed on some Technical tools or technical Indicators.
In this Blog, we will try to find out Technical situation on TSLA .Which will help you for Understanding and Trading on it.
So let's start:
Tesla/TSLA (NASDAQ)

In weekly chart ,In this situation the stock price is staying on Higher Low area.
One week ago who created short position at 275, they may book there 75% profit this area now(1 support line).
But still they may not book all position. I seemed after booking their 75%, they try to chance for next support area 240,(2 support line).
The fresh entry for long will be at 275, because RSI already break down own label with 'M" pattern
which is clear visible on image. The stock may more down to taking support on 2nd support area,which clearly visible on RSI label in image.
Now, I will discuss more about TSLA chart:

We know that all type chart pattern has a common rules,that Higher high or higher low type waves formation.
many trader can't understand or find. Because their mentality is short term trading type,
Any chart follow this rules , may be higher time frame(monthly chart or weekly chart).
RSI is another best indicators to finding this type waves and pattern.
According to 2nd picture we can trade with follow this wave with proper Stop Loss .
Every chart can speak there words,market doesn't want your loss.market wants to known how to trade on it, You have to Analysis every week end,minimum hundred stock for getting more knowledge from market.
When a momentum candle appear poor knowledge trader jump on it,like insect jumps on fire.they have to know a big bullish candle volume is never beater then there previous small candle's volume.
So , comment me for this blog. Useful or Not.
If any quarry for any Stock ,from Any country, I will try support everyone by Technical Analysis.
Thank You Everyone

In this condition some trader can a short term Short position . Here the big investor never carry their position on Call side.They will waiting for taking a fresh Short position entry.
Thank You Everyone
Stock Cloud- Stock Market Analysis.

1st- It is Day Candle wise chart ..... 2nd- Ready for Buy This Stock... 3rd- Will Breakout After Some Days.keep follow on it For more upda...
